Maryland
Back to mapTo get to zero by 2050, Maryland must cut emissions by 3.7% a year
Emissions in Maryland
Million metric tons of carbon dioxide (CO2)  equivalent (MTCO2e ) emissions
Note: Grey area indicates missing data due to processing delays.
Source: WRI, Mar 2021
This is how we're going to do it
- Boilers and furnaces with heat pumps
- Gas stoves with electric induction stoves
- No-till farming to keep CO2 in the soil
- Capturing methane leaks from landfills
- Capturing CO2 to make emissions-free concrete
- Burning green hydrogen to make emissions-free steel
- Plugging methane leaks from gas pipelines
Decarbonize Our Buildings
17% of Maryland's climate pollution comes from buildings.
We burn fossil fuels to heat our air, water, and food.
To cut this pollution...
Let's electrify our heat!
We'll replace...
...in all of Maryland's 1.7 million buildings.
In fact, 45.0% of appliances in buildings in Maryland are already fossil fuel free!
That means we only need to electrify the remaining 912,000 dirty buildings in Maryland. That's around 34,000 per year.
Source: Microsoft, Mar 2021; NREL, Dec 2021Electrifying all buildings cuts 17% of the pollution.
Decarbonize Our Transport
41% of Maryland's pollution comes from cars, trucks, trains, and planes.
But mostly from cars.
To cut this pollution,
your next car must be electric.
Or consider going car-free with public transit, bikes/e-bikes, car share, or other alternatives!
There are 1.8 million vehicles in Maryland and 18,000 are already electric (1% of the total).
We need to electrify (or replace) the remaining 1.8 million gas-powered vehicles. That's around 67,000 a year.
Source: DOT, Feb 2021Electrifying all transportation cuts 41% of the pollution.
Decarbonize Our Power
23% of Maryland's pollution comes from burning coal, gas, and oil to make power.
That's because of how power is generated in Maryland today.
Power Generation in the State of Maryland (2020)
But there's already 52% carbon-free electricity generation in Maryland!
To clean up the emissions from the polluting power plants we need to replace all fossil fuel power plants with solar and wind farms.
")
...and find good jobs for those workers.
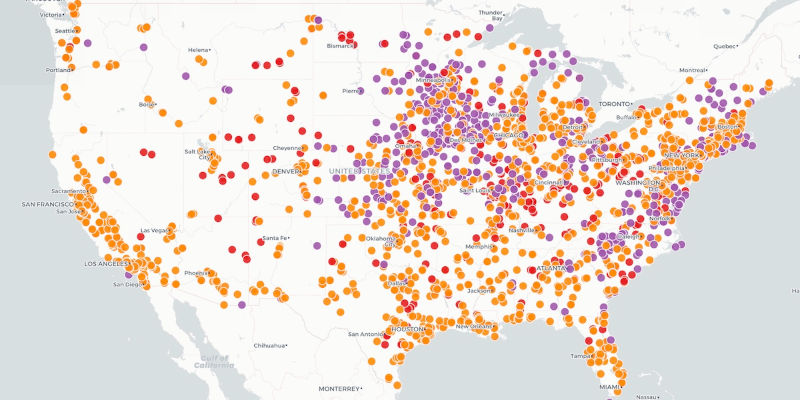
Current Fossil Fuel Power Plants in Maryland
5 coal plants

Chalk Point
Prince Georges County
2,553 MW
Morgantown
Charles County
1,548 MW
Brandon Shores
Anne Arundel County
1,370 MW
Herbert A Wagner
Anne Arundel County
1,059 MW
AES Warrior Run
Allegany County
229 MW
16 gas plants

Wildcat Point Generation Facility
Cecil County
1,114 MW
Dickerson
Montgomery County
933 MW
Keys Energy Center
Prince Georges County
831 MW
Rock Springs Generating Facility
Cecil County
774 MW
8 oil plants

County: Baltimore
Megawatt Capacity: 257
Utility: Constellation Power Source Gen")
Riverside (MD)
Baltimore County
257 MW
Vienna
Dorchester County
181 MW
Philadelphia
Baltimore City County
83 MW
Easton 2
Talbot County
39 MW
Easton
Talbot County
34 MW
Berlin
Worcester County
22 MW
Crisfield
Somerset County
12 MW
Smith Island
Somerset County
2 MW
But wait!
It's not enough to replace our power plants with wind and solar farms.
To power our electric cars and buildings, we need two times the electricity we have today.
In all, we'll need to build 5,000 megawatt (MW) of wind power and 5,000 MW of solar power.
Since the average wind turbine provides 2.75 MW of peak capacity, Maryland would need to install about 2,000 turbines.
Since Maryland already has 59 MW of wind and 194 MW of solar, that's 5,000 MW of wind power we need to build and 4,000 MW of solar power. That's around 175 MW of wind power and 163 MW of solar power a year.
Source: EIA, Apr 2022Decarbonizing all dirty power cuts 23% of the pollution.
And gives us zero-emissions power we need to eliminate pollution from buildings and cars!
Other Emissions
The last 19% of Maryland's climate pollution comes from other sources...
This includes farming, landfills, industry, and leaks from gas pipelines.
There's no one solution to solve these problems, but there are lots of great ideas:
That doesn't mean there's no solution, it just means that clean electrification doesn't help with these problems, and you could fill a whole book with covering all of them. We need to encourage our politicians to invest in researching new solutions and implementing existing solutions to these problems!
Ready to do your part?
Learn how to electrify your own machines and pass local policy to electrify the rest
Take Action